4. MatplotLib

matplotlib.pyplot은 데이터를 시각화하는 도구로, MATLAB과 비슷한 스타일의 그래프를 생성할 수 있습니다. 데이터를 그래프로 나타내는 기본적인 방법은 아래와 같습니다:
1. plot() 함수
• 데이터 리스트를 입력하여 선 그래프를 그립니다.
• plot([y 값 리스트]): y축 데이터만 지정하면, x축 값은 자동으로 인덱스(0, 1, 2, …)로 설정됩니다.
• plot([x 값 리스트], [y 값 리스트]): x축과 y축 데이터를 명시적으로 지정하여 그래프를 그립니다.
2. xlabel() 및 ylabel() 함수
• 각각 x축과 y축의 레이블(이름)을 설정합니다.
3. show() 함수
• 설정한 그래프를 출력합니다.
예제 코드
import matplotlib.pyplot as plt

# 첫 번째 그래프: y 값 리스트만 제공
plt.plot([1, 5, 9, 13])

# 두 번째 그래프: x와 y 값을 모두 제공
plt.plot([1, 2, 3, 4], [1, 4, 9, 16])

# 축 레이블 설정
plt.xlabel("x-label")
plt.ylabel("y-label")

# 그래프 출력
plt.show()
실행 결과

1. 첫 번째 그래프는 y값 [1, 5, 9, 13]과 자동으로 할당된 x값 [0, 1, 2, 3]으로 선이 그려집니다.
2. 두 번째 그래프는 x값 [1, 2, 3, 4]과 y값 [1, 4, 9, 16]으로 선이 추가됩니다.
3. x축에는 "x-label", y축에는 "y-label"이 표시됩니다.
matplotlib.pyplot의 plot() 함수에서는 다양한 포맷 옵션을 조합하여 그래프를 더 세부적으로 제어할 수 있습니다. 아래는 포맷 옵션에 대한 설명과 사용법입니다.
1. 마커(marker)
데이터 포인트를 표시하는 모양입니다.
• 사용 가능한 마커:
• o: 원
• x: X 마크
• d: 마름모
• <: 왼쪽 삼각형
• >: 오른쪽 삼각형
• s: 정사각형
• p: 오각형
• *: 별
• h: 육각형
• +: 더하기 기호
2. 라인 종류(line style)
선의 모양을 결정합니다.
• 사용 가능한 라인 종류:
• '-': 실선
• '--': 점선
• '-.': 점-대시 혼합
• ':': 점선(콜론 형태)
3. 컬러(color)
선과 마커의 색상을 지정합니다.
• 사용 가능한 컬러 코드:
• k: 검정(black)
• r: 빨강(red)
• g: 초록(green)
• b: 파랑(blue)
• c: 청록(cyan)
• m: 자홍(magenta)
• y: 노랑(yellow)
• w: 흰색(white)
4. 포맷 문자열 조합
위의 마커, 라인 스타일, 컬러를 문자열로 조합하여 사용합니다.
• 포맷: "컬러라인스타일마커"
예) "ro--": 빨강(r) 원(o) 점선(–)
예) "g*-.": 초록(g) 별(*) 점-대시(-.)
5. 축 범위 지정
• axis([xmin, xmax, ymin, ymax]): 그래프의 x축과 y축 범위를 설정합니다.
예제 코드
import matplotlib.pyplot as plt
plt.plot([1, 2, 3, 4], [1, 4, 9, 16], 'ro')
plt.plot([1, 2, 3, 4], [2, 5, 10, 17], 'k--')
plt.plot([1, 2, 3, 4], [3, 6, 11, 18], 'd-.')
plt.axis([0, 5, 0, 20])
plt.show()
실행 결과

numpy 데이터를 활용하여 그래프를 그리면, 고속 계산 및 간결한 코드로 다양한 데이터를 시각화할 수 있습니다. numpy의 유니버설 함수(universal functions)와 브로드캐스팅(broadcasting) 기능은 그래프 데이터를 효율적으로 생성하는 데 유용합니다.
핵심 개념
1. 유니버설 함수 (Universal Functions)
• numpy에서 제공하는 함수로 배열의 요소별 연산을 빠르게 수행합니다.
• 예: np.sin(), np.cos(), np.exp(), np.sqrt() 등.
2. 브로드캐스팅 (Broadcasting)
• 배열 간의 크기가 다르더라도 자동으로 크기를 맞춰 연산을 수행합니다.
• 예: 스칼라와 배열, 또는 크기가 다른 배열끼리 연산 가능.
예제: numpy와 matplotlib를 이용한 그래프 그리기
import matplotlib.pyplot as plt
import numpy as np
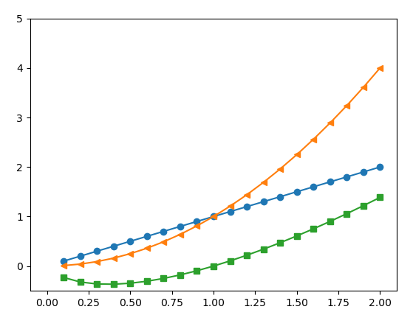
t = np.arange(0.1, 2.1, 0.1)

plt.plot(t, t, "o-", t, t**2, "<-", t, np.log(t)*t, "s-")
plt.axis([-0.1, 2.1, -0.5, 5])
plt.show()
실행 결과

matplotlib.pyplot은 다양한 플롯 유형을 제공하여 데이터의 특성에 맞게 시각화할 수 있습니다. 아래는 주요 플롯 함수와 간단한 예제를 소개합니다.
1. bar(): 수직 바 플롯
import matplotlib.pyplot as plt

categories = ['A', 'B', 'C', 'D']
values = [5, 7, 3, 8]

plt.bar(categories, values, color='skyblue')
plt.xlabel("Categories")
plt.ylabel("Values")
plt.title("Vertical Bar Plot")
plt.show()
2. barh(): 수평 바 플롯
plt.barh(categories, values, color='lightgreen')
plt.xlabel("Values")
plt.ylabel("Categories")
plt.title("Horizontal Bar Plot")
plt.show()
3. boxplot(): 박스 플롯 (위스커 포함)
import numpy as np

data = [np.random.normal(0, 1, 100), np.random.normal(1, 2, 100), np.random.normal(2, 1, 100)]
plt.boxplot(data, labels=['Group 1', 'Group 2', 'Group 3'])
plt.title("Box Plot")
plt.show()
4. errorbar(): 오류 바 플롯
x = [1, 2, 3, 4, 5]
y = [2.1, 2.5, 2.9, 3.4, 4.0]
y_err = [0.2, 0.1, 0.3, 0.4, 0.2]

plt.errorbar(x, y, yerr=y_err, fmt='o', capsize=5, color='purple', label='Data')
plt.xlabel("X-axis")
plt.ylabel("Y-axis")
plt.title("Error Bar Plot")
plt.legend()
plt.show()
5. hist(): 히스토그램
data = np.random.randn(1000)
plt.hist(data, bins=20, color='orange', edgecolor='black')
plt.xlabel("Bins")
plt.ylabel("Frequency")
plt.title("Histogram")
plt.show()
6. pie(): 파이 차트
sizes = [25, 35, 15, 25]
labels = ['Category A', 'Category B', 'Category C', 'Category D']
colors = ['gold', 'lightblue', 'lightgreen', 'pink']
explode = (0.1, 0, 0, 0)  # 첫 번째 조각 분리

plt.pie(sizes, labels=labels, colors=colors, explode=explode, autopct='%1.1f%%', startangle=90)
plt.title("Pie Chart")
plt.show()
7. plot(): 라인 플롯
x = np.linspace(0, 10, 100)
y = np.sin(x)

plt.plot(x, y, label='sin(x)')
plt.xlabel("X-axis")
plt.ylabel("Y-axis")
plt.title("Line Plot")
plt.legend()
plt.show()
8. scatter(): 스캐터 플롯
x = np.random.rand(100)
y = np.random.rand(100)
colors = np.random.rand(100)
sizes = np.random.rand(100) * 100

plt.scatter(x, y, c=colors, s=sizes, alpha=0.5, cmap='viridis')
plt.colorbar(label='Color Intensity')
plt.xlabel("X-axis")
plt.ylabel("Y-axis")
plt.title("Scatter Plot")
plt.show()

matplotlib를 활용하여 그래프를 배열 형태로 구성하고 스타일을 적용하는 방법을 정리하면 다음과 같습니다.
1. subplots(rows, cols)로 다중 그래프 생성
subplots(rows, cols)는 그래프 공간을 rows x cols 배열로 나눠 여러 그래프를 동시에 표시할 수 있습니다.
사용법
• fig: 전체 그래프 영역을 나타내는 Figure 객체.
• ax: 각 그래프를 나타내는 Axes 객체 배열.
• ax[r, c]: 배열 인덱스를 사용하여 특정 위치의 그래프를 선택.
예제 코드
import matplotlib.pyplot as plt
import numpy as np

# 데이터 생성
x = np.linspace(0, 10, 100)
y1 = np.sin(x)
y2 = np.cos(x)

# 2x2 배열로 그래프 공간 나누기
fig, ax = plt.subplots(2, 2, figsize=(10, 8))  # 2행 2열 배열 생성

# 각 위치에 그래프 추가
ax[0, 0].plot(x, y1, label='sin(x)', color='r')
ax[0, 0].set_title("Top Left")
ax[0, 0].legend()

ax[0, 1].plot(x, y2, label='cos(x)', color='b')
ax[0, 1].set_title("Top Right")
ax[0, 1].legend()

ax[1, 0].plot(x, y1 + y2, label='sin(x) + cos(x)', color='g')
ax[1, 0].set_title("Bottom Left")
ax[1, 0].legend()

ax[1, 1].plot(x, y1 - y2, label='sin(x) - cos(x)', color='k')
ax[1, 1].set_title("Bottom Right")
ax[1, 1].legend()

# 간격 조정 및 그래프 출력
plt.tight_layout()
plt.show()
2. matplotlib.style로 스타일 변경
기능
• matplotlib.style은 그래프의 폰트, 배경색, 그리드 등 전반적인 스타일을 변경하는 데 사용됩니다.
• 스타일을 적용하면 코드 수정 없이 그래프의 전체적인 모양을 변경할 수 있습니다.
주요 명령어
1. 사용 가능한 스타일 확인
import matplotlib.pyplot as plt
print(plt.style.available)
출력 예:
['seaborn-darkgrid', 'ggplot', 'fast', 'classic', 'bmh', ...]
2. 스타일 적용
plt.style.use('ggplot') # 'ggplot' 스타일 적용
3. 스타일 변경과 다중 그래프 함께 사용하기
import matplotlib.pyplot as plt
import numpy as np

# 데이터 생성
x = np.linspace(0, 10, 100)
y1 = np.sin(x)
y2 = np.cos(x)

# 스타일 적용
plt.style.use('bmh')

# 다중 그래프 생성
fig, ax = plt.subplots(2, 1, figsize=(8, 6))

# 그래프 추가
ax[0].plot(x, y1, label='sin(x)', color='purple', linestyle='--')
ax[0].set_title("Sine Function")
ax[0].legend()

ax[1].plot(x, y2, label='cos(x)', color='orange', linestyle=':')
ax[1].set_title("Cosine Function")
ax[1].legend()

# 간격 조정 및 그래프 출력
plt.tight_layout()
plt.show()
import matplotlib.pyplot as plt
import matplotlib.style
import numpy as np
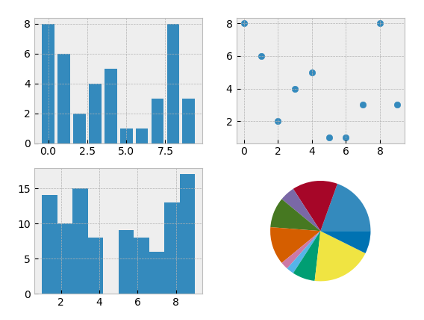
matplotlib.style.use('bmh')
_, ax = plt.subplots(2, 2)
s = np.arange(0, 10)
t = np.random.randint(1, 10, 10)
r = np.random.randint(1, 10, 100)
ax[0, 0].bar(s, t)
ax[0, 1].scatter(s, t)
ax[1, 0].hist(r)
ax[1, 1].pie(t)
plt.show()

annotate(...)와 legend(...)를 사용하여 그래프에 메모와 범례를 추가하는 방법
1. annotate(): 그래프에 메모 달기
annotate()는 특정 데이터 포인트에 주석(메모)을 추가하는 데 사용됩니다.
주요 매개변수
• text: 주석으로 표시할 텍스트.
• xy: 주석을 추가할 데이터 포인트의 좌표 (x, y).
• xytext: 주석 텍스트가 위치할 좌표 (x, y) (선택사항).
• arrowprops: 화살표 속성을 지정 (선택사항).
예제 코드
import matplotlib.pyplot as plt
import numpy as np

# 데이터 생성
x = np.linspace(0, 10, 100)
y = np.sin(x)

# 그래프 그리기
plt.plot(x, y, label="sin(x)", color="blue")

# 메모 추가
plt.annotate("Local Max", xy=(1.5 * np.pi, 1), xytext=(5, 1.5),
             arrowprops=dict(facecolor='black', arrowstyle='->'))

# 레이블 추가
plt.xlabel("x-axis")
plt.ylabel("y-axis")
plt.title("Graph with Annotation")
plt.legend()
plt.grid()
plt.show()
2. legend(): 그래프에 범례 달기
legend()는 그래프에 범례를 추가합니다.
범례는 데이터의 각 선이나 점이 무엇을 나타내는지 설명합니다.
사용법
• 자동 범례: plot() 함수의 label 매개변수를 사용하고, legend()를 호출하면 자동으로 추가됩니다.
• 수동 범례: legend()에 리스트로 설명을 전달할 수 있습니다.
예제 코드
# 데이터 생성
x = np.linspace(0, 10, 100)
y1 = np.sin(x)
y2 = np.cos(x)

# 그래프 그리기
plt.plot(x, y1, label="sin(x)", color="blue")
plt.plot(x, y2, label="cos(x)", color="red")

# 범례 추가
plt.legend(loc="upper right")  # 위치: 오른쪽 위
plt.xlabel("x-axis")
plt.ylabel("y-axis")
plt.title("Graph with Legend")
plt.grid()
plt.show()
범례 위치 옵션 (loc)
| 옵션 | 설명 |
| best | 자동으로 최적의 위치 |
| upper right | 오른쪽 위 |
| upper left | 윈쪽 위 |
| lower right | 오른쪽 아래 |
| lower left | 왼쪽 아래 |
| center | 중앙 |
import matplotlib.pyplot as plt
import numpy as np
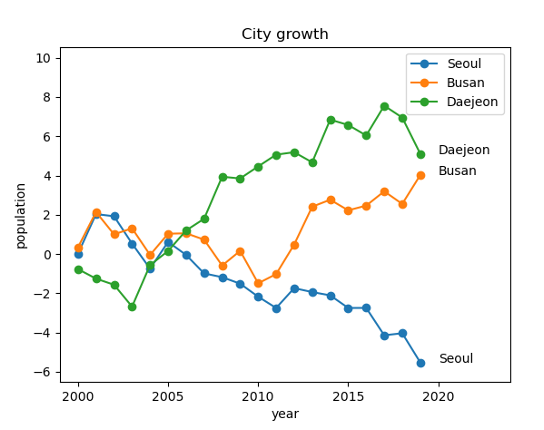
cities = ["Seoul", "Busan", "Daejeon"]
y = np.arange(2000, 2020, dtype=int)
min, max = 0, 0
for c in cities:
    t = np.random.randn(20).cumsum()
    plt.plot(y, t, "o-")
    plt.annotate(s=c, xy=(2020, t[19]))
    if min > t.min(): min = t.min()
    if max < t.max(): max = t.max()
plt.axis([1999, 2024, min-1, max+3])
plt.title("City growth")
plt.xlabel("year")
plt.ylabel("population")
plt.legend(cities)
plt.show()

'Lecture > 파이썬으로 만드는 AI 오델로 게임' 카테고리의 다른 글
| 5 랜덤시도를 통하여 순차 결정 문제 해결 (4) | 2024.11.24 |
|---|---|
| 4. 파이썬을 이용한 데이터 과학 소개(part 2) (1) | 2024.11.20 |
| 4. 파이썬을 이용한 데이터 과학 소개(part 1) (4) | 2024.11.15 |
| 3. 강화학습을 위한 순차 결정 문제 소개 (10) | 2024.11.10 |
| 2. 인공지능과 강화학습 소개 (2) | 2022.09.25 |


댓글